There’s a story in every study, data set, and list of numbers. And as a former fundraiser and the current Fundraiser in Residence at Virtuous, one of my favorite pastimes is finding these stories in nonprofit data. That’s why one of the first pieces of content I initiated when I joined Virtuous was the Virtuous Nonprofit Benchmark Report (a look at how nonprofits perform across fundraising metrics). And that’s also why I always enjoy it when June comes around, and I have a new set of data to analyze: the Giving USA 2026 report.
At Virtuous, we build fundraising tools designed to engage donors with the same personal connections and experiences they receive from today’s leading brands. And this all starts with data and knowing how and what donors choose to give.
In this post, I’ll share my honest assessment of the data, the stories I found, and how you can go from just reading the Giving USA 2026 report…to making smart next moves for your nonprofit, grounded in this data.
The TL;DR:
- Americans gave a record $617.2 billion to charity in 2025.
- Every source of giving went up. After a couple of genuinely hard years, individual giving grew again.
- So here’s the question I keep coming back to: If giving is at an all-time high, why does growth still feel so hard for so many teams?
- My take? The answer lies in relationship-building with current donors.
This post explores how to make that happen. I’ll run Giving USA 2026 data against our own 2026 Nonprofit Benchmark Report data for an honest look at the sector.
Giving USA 2026 Overview: 2025 Charitable Giving Totaled $617.2 Billion
U.S. charitable giving reached $617.2 billion in 2025, up 5.7% in current dollars and 3.0% after inflation. It’s the first time giving has crossed $600 billion, and the second-highest inflation-adjusted total on record. Put another way, 2025 charitable giving grew faster than the cost of living for the first time in a few years.
A few takeaways worth sitting with:
- Total giving hit a record and, unlike two years ago, actually outpaced inflation. A record that doesn’t beat inflation isn’t really a record.
- Every source of giving rose. No source declined. But a rising national number doesn’t tell you whether your donors are getting deeper or whether you’re just replacing the ones you lost.
- Individual giving grew again (+1.4% after inflation) after two down years.
- Over the long haul, individuals make up a smaller share of total giving than they used to. Roughly 80% of the total in the late 1980s, down to about 65% in the most recent five-year span, as foundation and donor-advised-fund giving has risen.
- As a takeaway, you can think through where your own giving growth or decline came from, and we’ll give you some theories based on our data
Sources of Giving in the Giving USA 2026 Data
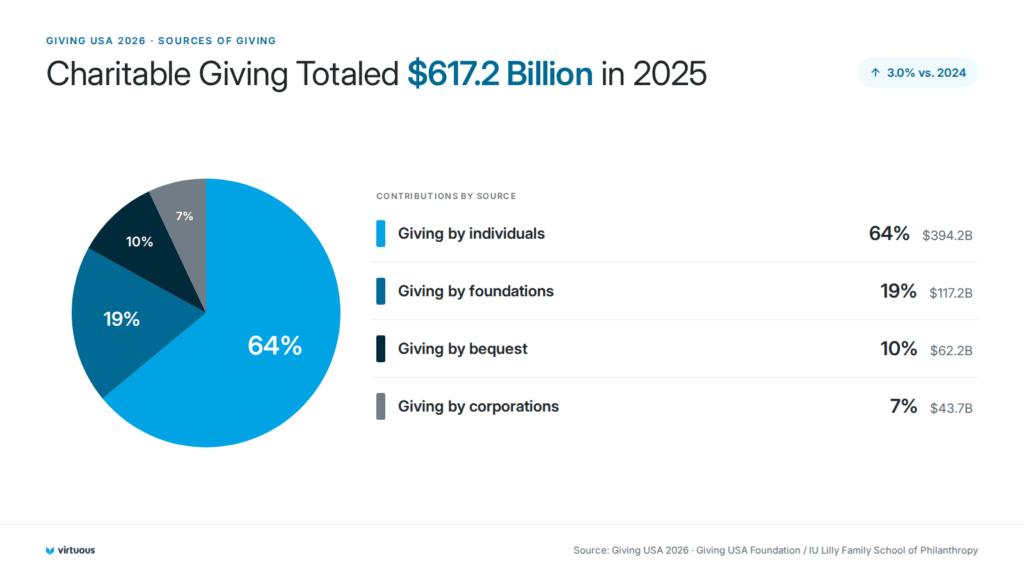
Giving USA breaks the total into four sources. Each one tells you something a little different about the year.
Individual Giving (64%, $394.2B)
Individuals still give the majority of every charitable dollar in America. And after two rough years, individual giving returned to growth, up 1.4% adjusted for inflation. Good news for the sector overall.
The theme of our own 2026 Virtuous Nonprofit Benchmark Report was depth, not breadth…meaning the most successful nonprofits in our study were able to cultivate deep relationships within their existing donor base. Not just acquire new donors.
Now, let’s look at this through the lens of our own Benchmark Report.
Across the 771 nonprofits in the study, only about 1 in 4 first-time donors came back to give a second gift. The first-to-second-gift rate was 25.84%. Which means roughly three out of every four new donors never return.
If the individual number went up, where did the growth come from? The donors who stayed. Retention held about flat year over year, but the average donor’s lifetime value jumped nearly 18%. Same base of people, worth more.
That’s why the depth, not breadth, is the theme, and the Giving USA 2026 story furthers this sentiment.
Foundation Giving (19%, $117.2B)
Foundation giving grew again (+3.0% after inflation), and its share of the total has been climbing for decades.
A lot of that shift is about how major donors move their money, not whether they’re generous. More and more higher-capacity donors are giving through foundations and donor-advised funds rather than writing a personal check. Worth keeping in mind when you’re thinking about your own major donor strategy.
Bequest Giving (10%, $62.2B)
Bequests were the big mover in the Giving USA 2026 data. Giving through estates jumped 19.7% in current dollars (16.6% after inflation), the largest increase of any source. Three of the past four years have shown big growth in bequests.
Think about what a bequest actually is. It’s the deepest commitment a donor can make. Nobody leaves a gift in their will after one transactional interaction. That kind of gift is the result of a relationship built over a lifetime. So this surge is depth paying off, in the most literal way there is.
There’s a flip side, though. Bequests come in waves. A few large estates can swing the whole number in a given year, which is exactly why the category moves so much. And that volatility points to a bigger risk worth naming: when your revenue leans on a small number of very large gifts, it gets fragile.
That’s why spreading your giving across all four sources…individual, foundation, bequest, and corporate…tends to make for a steadier, more resilient revenue base.
We had a similar takeaway in our portfolio balance metric in the Virtuous Benchmark Report. About two-thirds of all nonprofit revenue comes from major donors. The organizations most concentrated in major gifts are also the ones that saw the biggest year-over-year swings. While our data focused on donor type vs. giving sources, the same concept applies: A steadier year usually comes down to this: don’t let any one source carry too much of the load.
Corporate Giving (7%, $43.7B)
Corporate giving grew steadily (+3.1% in current dollars, essentially flat at +0.5% after inflation) and stays the smallest of the four sources.
It’s a useful supplement, especially through matching gift programs, which leave real money on the table at a lot of organizations. But it isn’t the ground you build long-term growth on. The durable growth still lives in the donor relationships you own directly.
Where the Money Went: Giving by Cause in Giving USA 2026
Giving USA also tracks where all that money landed, not just where it came from. Here’s how the $617.2 billion broke down by cause in 2025 (figures rounded):
- Religion: $151.6 billion (23%)
- Human services: $99.5 billion (15%)
- Education: $92 billion (14%)
- Gifts to grantmaking foundations: $79.1 billion (12%)
- Public-society benefit: $72.1 billion (11%)
- Health: $61.4 billion (9%)
- International affairs: $33 billion (5%)
- Arts, culture, and humanities: $27.3 billion (4%)
- Gifts to individuals: $25.8 billion (4%)
- Environment and animals: $24.6 billion (4%)
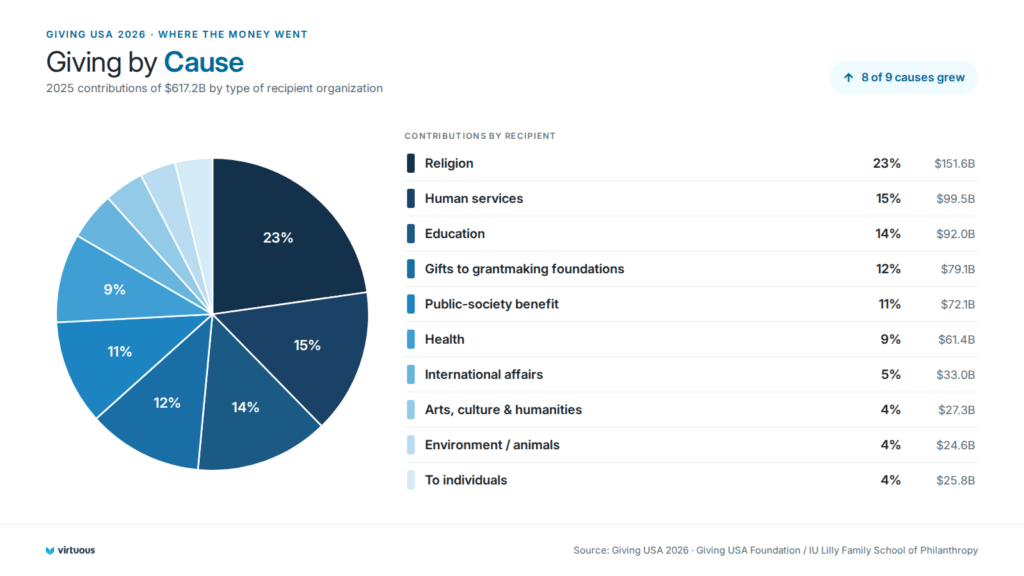
Nearly every category grew this year (8 of the 9 recipient subsectors rose in current dollars), with education, public-society benefit, and environment/animals rising fastest, each up more than 11%.
Religion, the largest recipient by far, was the exception: it grew just 2.4% and was essentially flat after inflation, and its share of total giving has slowly declined over decades, even as the dollar total holds. So this was a year of real but uneven growth across causes, not a rising tide lifting everything equally.
If you’re interested in learning more about fundraising across sectors, I encourage you to read our sector-specific benchmark reports from this year:
These reports take the fundraising metrics even further and make them applicable for nonprofits in these spaces.
The Story Underneath the Giving USA 2026 Numbers: Depth, Not Breadth
So back to the question from the top. Giving is at a record. Generosity is strong. Why does growth still feel so hard?
Part of the answer is that the field keeps getting more crowded. The number of U.S. nonprofits has climbed from about 1.1 million in 2014 to more than 1.5 million in 2024, growing every single year. Meanwhile, total giving has held roughly 2% of GDP for four decades. More organizations, reaching into a pie that isn’t growing to match. No wonder it feels like a grind, even in a record year.
And remember, the individual donors everyone is competing for make up a smaller slice of the total than they used to. Which means the individual donors you already have aren’t less valuable in this environment. They’re more.
Giving USA tells us individual giving grew again. What it can’t tell us is how: more new donors, or deeper relationships with the ones already in the file. That’s the exact question our Benchmark Report was built to answer. And the answer, pretty clearly, is depth.
Three findings make the case:
- Gift frequency is a brand-new metric in this year’s report, and it measures depth directly: how many times the average donor gives per year. The average was 4.15 gifts. Top-quartile organizations saw 6.62. The donors who show up more often are the ones you almost never lose.
- The median gift rose about 20%. When the median climbs, not just the average, it means the growth is happening across the broad middle of your donor base, not from a couple of big gifts pulling the number up.
- Recurring giving held steady at about 21% of revenue (44% for top performers). Recurring is the durable version of the individual-giving growth Giving USA reported. A monthly donor isn’t re-won every year. They just stay. Making recurring the easy, obvious choice at the moment someone gives is one of the highest-leverage things you can do.
The commonality between all of these metrics? Going deeper with the giving you already have.
What Should You Do With the Giving USA 2026 Data?
Now, let’s get practical. And ask some hard questions.
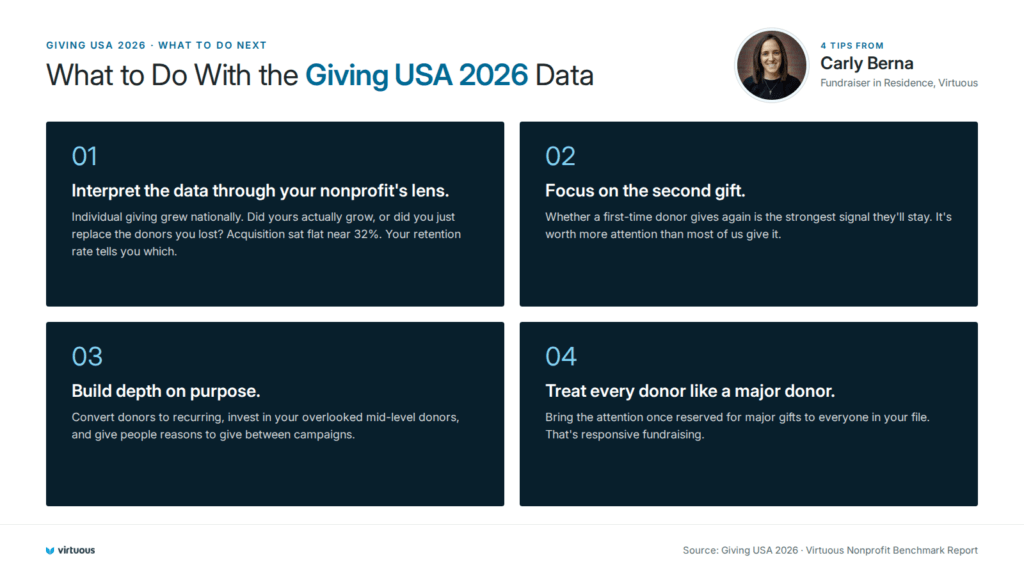
Interpret the data through your nonprofit’s lens.
Individual giving grew nationally. Did yours actually grow, or did you replace the donors you lost?
In the 2026 Virtuous Nonprofit Benchmark Report, new-donor acquisition sat flat at about 32%. A number like that can mean healthy growth, or it can mean you’re refilling a leaking bucket. The acquisition rate alone won’t tell you which. Your retention numbers will.
Focus on the second gift, not just the first.
Whether a new donor makes a second gift is the strongest early signal of whether they’ll stick around at all. It’s worth more attention than most of us give it.
Build depth on purpose.
Convert one-time donors to recurring. Invest in your mid-level donors, who tend to be the most overlooked people in the whole file. Give supporters more reasons to give between your big campaigns.
Treat every donor like a major donor.
It’s what we believe, and it’s the whole point of responsive fundraising. The organizations pulling ahead are the ones bringing the kind of attention once reserved for major gifts to everyone in the file.
Depth Is the Work Now
Here’s what I keep coming back to. The money is there. Generosity is strong. That part is genuinely good news, and we don’t say it enough.
But a record topline won’t grow your organization on its own. The nonprofits that pull ahead over the next few years won’t be the ones that reach the most program recipients. They’ll be the ones who go deeper with the donors they already have.
That’s harder than acquisition. It’s also more durable. And honestly, it’s more in line with why most of us got into this work in the first place.
Top Resources for You
Read the Giving USA 2026 Report
To see the numbers for yourself, I encourage you to read the Giving USA 2026 full report.
Read the 2026 Virtuous Benchmark Report
If you’re into the data like me, and you want to see this year’s numbers for yourself, you can read the 2026 Virtuous Nonprofit Benchmark Report below.
Take the Health Check
Not sure where your own numbers land against the benchmarks? That’s exactly what the Benchmark Health Check is for. You plug in your metrics and get a snapshot of where you stand and where a focused effort would do the most good.
Use Our Fundraising Tools to Get There
Virtuous is an integrated suite of enterprise-grade software built to connect personally with every donor, automate workflows to save time, and turn data into action.
We build the responsive fundraising platform behind a lot of the depth metrics in this post. If you want to go deeper with your donors, these are the tools that help you do it:
- Virtuous CRM+ — Our nonprofit CRM for donor management, automation, and workflows. The hub that keeps your donor data and outreach in one place.
- Virtuous Momentum — Our AI fundraising assistant for gift officers, with AI-drafted outreach, daily prioritized lists, and donor plans, so your team can follow up fast and personally.
- Virtuous Raise — Our online giving platform for donation forms, campaign pages, and recurring giving that meets donors in the moment.
- Virtuous Insights — Donor intelligence with wealth data, predictive modeling, and donor scoring to help you spot who’s ready to upgrade, give recurring, or lapse.
- Virtuous Analytics — Reporting and dashboards for tracking lifetime value, retention, and the other depth metrics by donor segment.
- Virtuous Volunteer — Volunteer management for scheduling, communication, and turning volunteers into engaged supporters.
About Giving USA and the Giving USA Foundation
The Giving USA annual report is the longest-running report on charitable giving in the United States, now in its 70th year. It’s researched and written by the Indiana University Lilly Family School of Philanthropy and published by the Giving USA Foundation, and it estimates giving flowing to more than 1.5 million U.S. charities. Virtuous is a proud supporter of Giving USA.
The 2026 edition’s findings were released in June 2026, with the full report following in July. It covers charitable giving for the year 2025.
About Virtuous
Virtuous is a proud member of The Giving Institute and the Giving USA community. We’re also the responsive fundraising software platform built to help nonprofits grow generosity by building more personal relationships with donors, no matter the gift size. Thousands of nonprofit teams use Virtuous CRM+, online giving, marketing automation, volunteer management, and donor intelligence tools to raise more, save time, and treat every donor like a major donor.
Giving USA 2026 FAQs
What is Giving USA 2026?
Giving USA 2026 is the annual report on U.S. charitable giving covering the year 2025. It’s researched by the Indiana University Lilly Family School of Philanthropy and published by the Giving USA Foundation, and it’s the longest-running report of its kind, now in its 70th year.
When was Giving USA 2026 released?
The report’s findings were released in June 2026, with the full report following in July 2026. It reports on giving for calendar year 2025.
How much did Americans give to charity in 2025?
Americans gave a record $617.2 billion to charity in 2025, up 5.7% in current dollars and 3.0% after inflation. It was the first year total giving crossed $600 billion.
What’s the difference between Giving USA and the Virtuous Benchmark Report?
Giving USA measures charitable giving at the national level: how much was given, and from which sources. The Virtuous Benchmark Report looks at donor behavior inside individual organizations, using data from 771 nonprofits, to show what donors do once they’re in your database (retention, gift frequency, lifetime value, recurring giving, and more). One is the macro picture; the other is what’s happening in your own file.
Is charitable giving actually growing?
Yes. Total U.S. giving hit a record $617.2 billion in 2025 and grew 3.0% after inflation, with every source of giving rising. That’s a real turnaround from the 2023 giving year, when giving grew in current dollars but fell behind inflation, as we covered in our previous Giving USA breakdown. But the latest Giving USA statistics describe national growth, which doesn’t automatically mean growth for any single organization. As the Benchmark Report shows, most of the sector’s real growth is coming from stronger donor retention and deeper relationships with existing donors rather than from acquiring new ones.